MACHINE LEARNING COURSE - PIERO SAVASTANO
Ref:
- ML-diabets
- ML-iris
- ML-text-vectorization
- ML-sentiment-analysis
- ML-missing-values
- ML-wines
- ML-random
- ML-seaborn
- ML-deep-learning
- ML-bikes
Background explanations
- In normal programming we have y = f(x) and the programmer given an input writes the algoritmh that calculates the output. In ML a big input of x and y is given and the function is generated from the ML model.
- A big amount of data is used to "feed" the ML algoritmh, it uses the data to create and train the model that will interact with the final user.
- Machine Learning figures out datasets into a Cartesian plane, the model is the function that tryes to intepolate (in case of regressor algoritmh) or split (in case of classifier algoritmh) all the points (drawn from dataset) on the plane.
Learning Algorithms
Regressor
Type of algoritmh that will always return a numeric value
Linear regression
- returns a function that relates X and y where y must a number
Classifier
Type of algoritmh that will return a category
BernoulliNB
Bernoulli Naive Bayes classifier is from years 80s and it was used for spam detection.
It's based on probability and it's a supervised learning algorithm
Index parameters
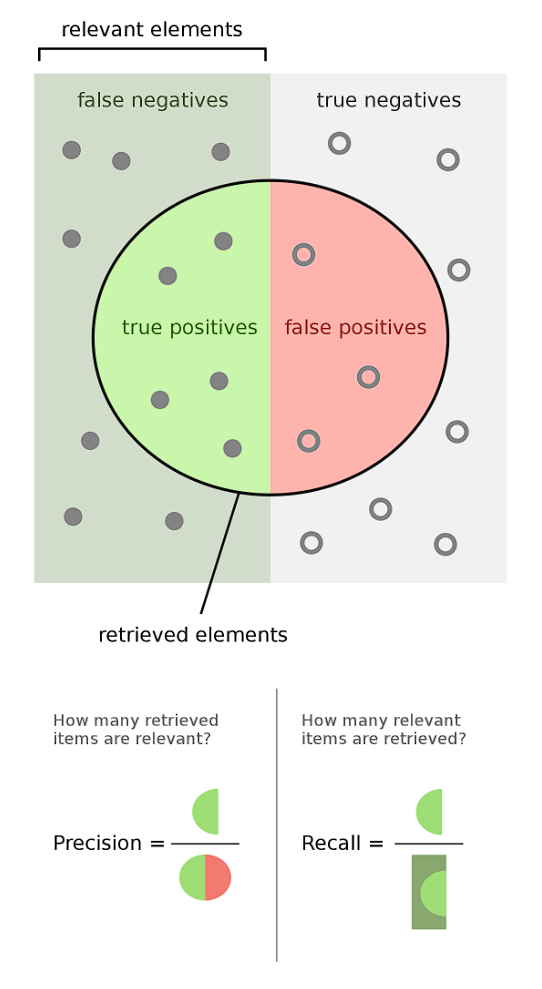
What is inside the circle is model prediction, what is outside is real world state.
Based on the problem we're trying to solve we have to evaluate if focus on precision or on recall, generally they are inversely proportional so precision increasement reflects on recall decreasement.
PRECISION
Precision is the difference between the correctly predicted cases as true and the total between both wrongly and correctly predicted true cases.
It answers to the question "how many times the model predicted true and it was really true?"
EX. When a high precision alarm goes off, it's sure the thief is present, but it's not sure it goes off every time there's a thief.
RECALL
Recall works with cases correctly predicted as true (A) and cases wrongly predicted as true (B):
R = A / (A + B)
EX. A high recall alarm goes off a lot of times but isn't sure that there's a thief
It answers to the question "between true cases, how many time the model really predicted true?"
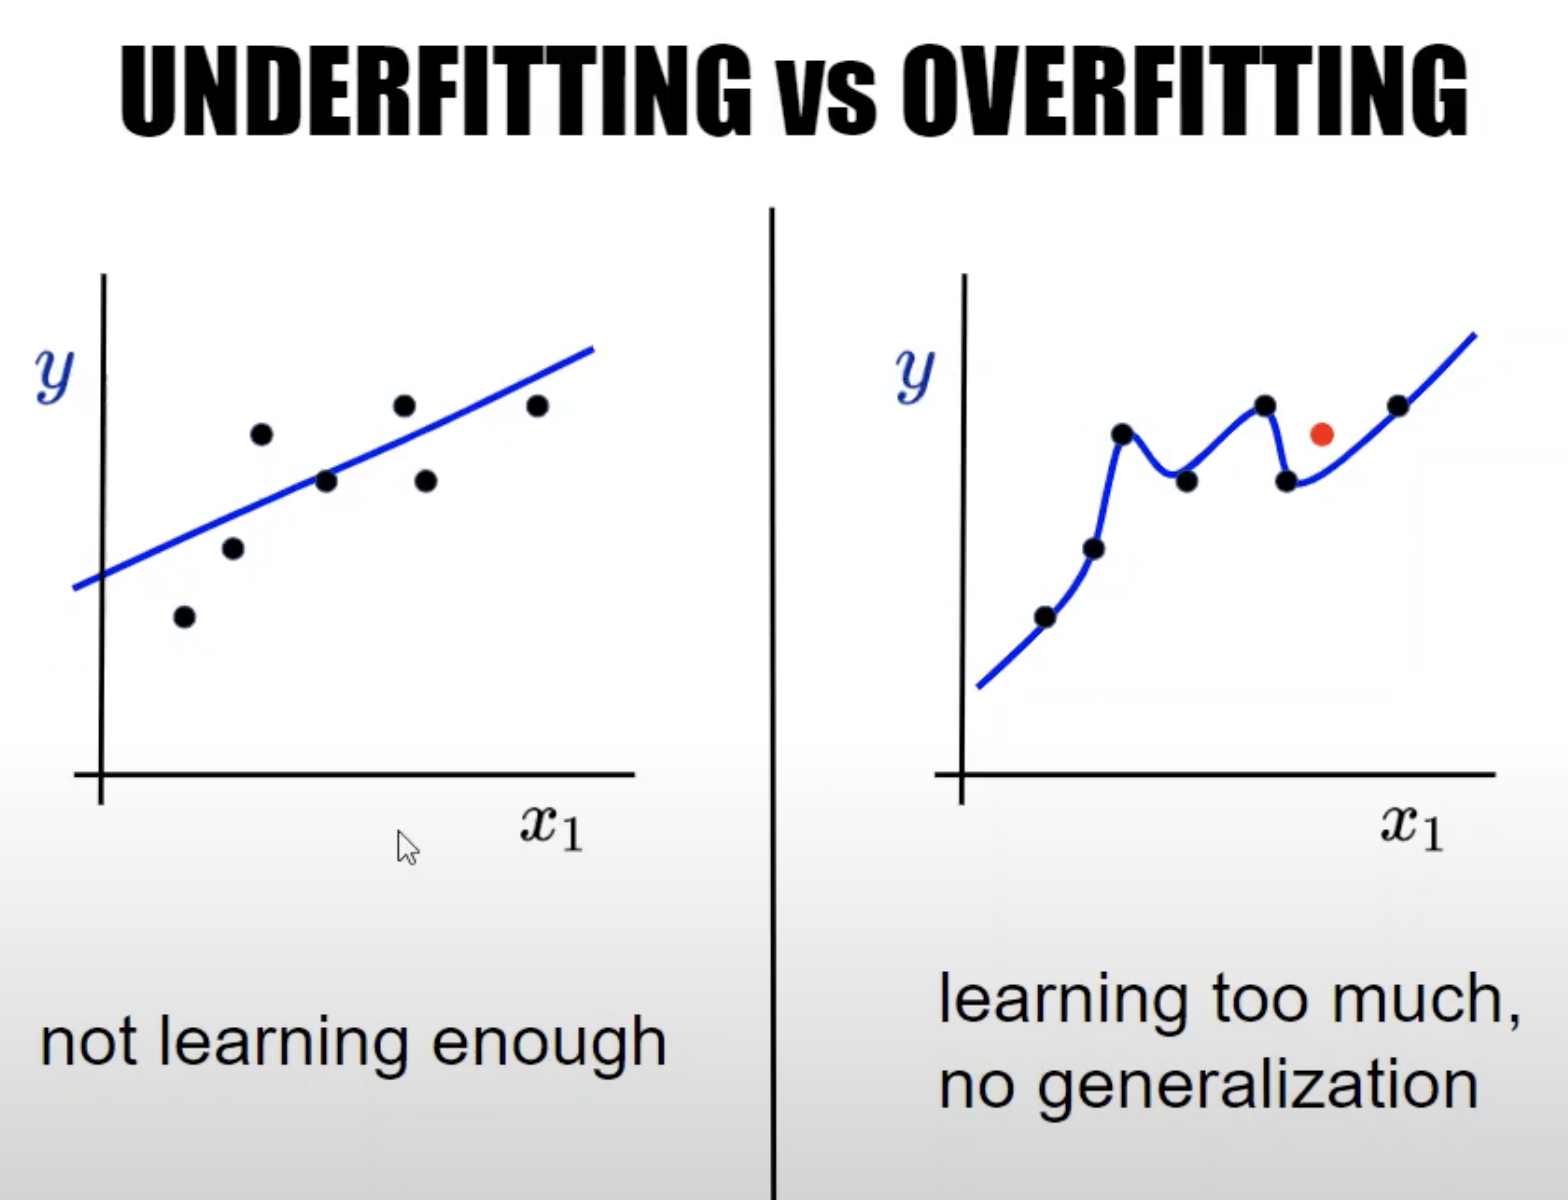
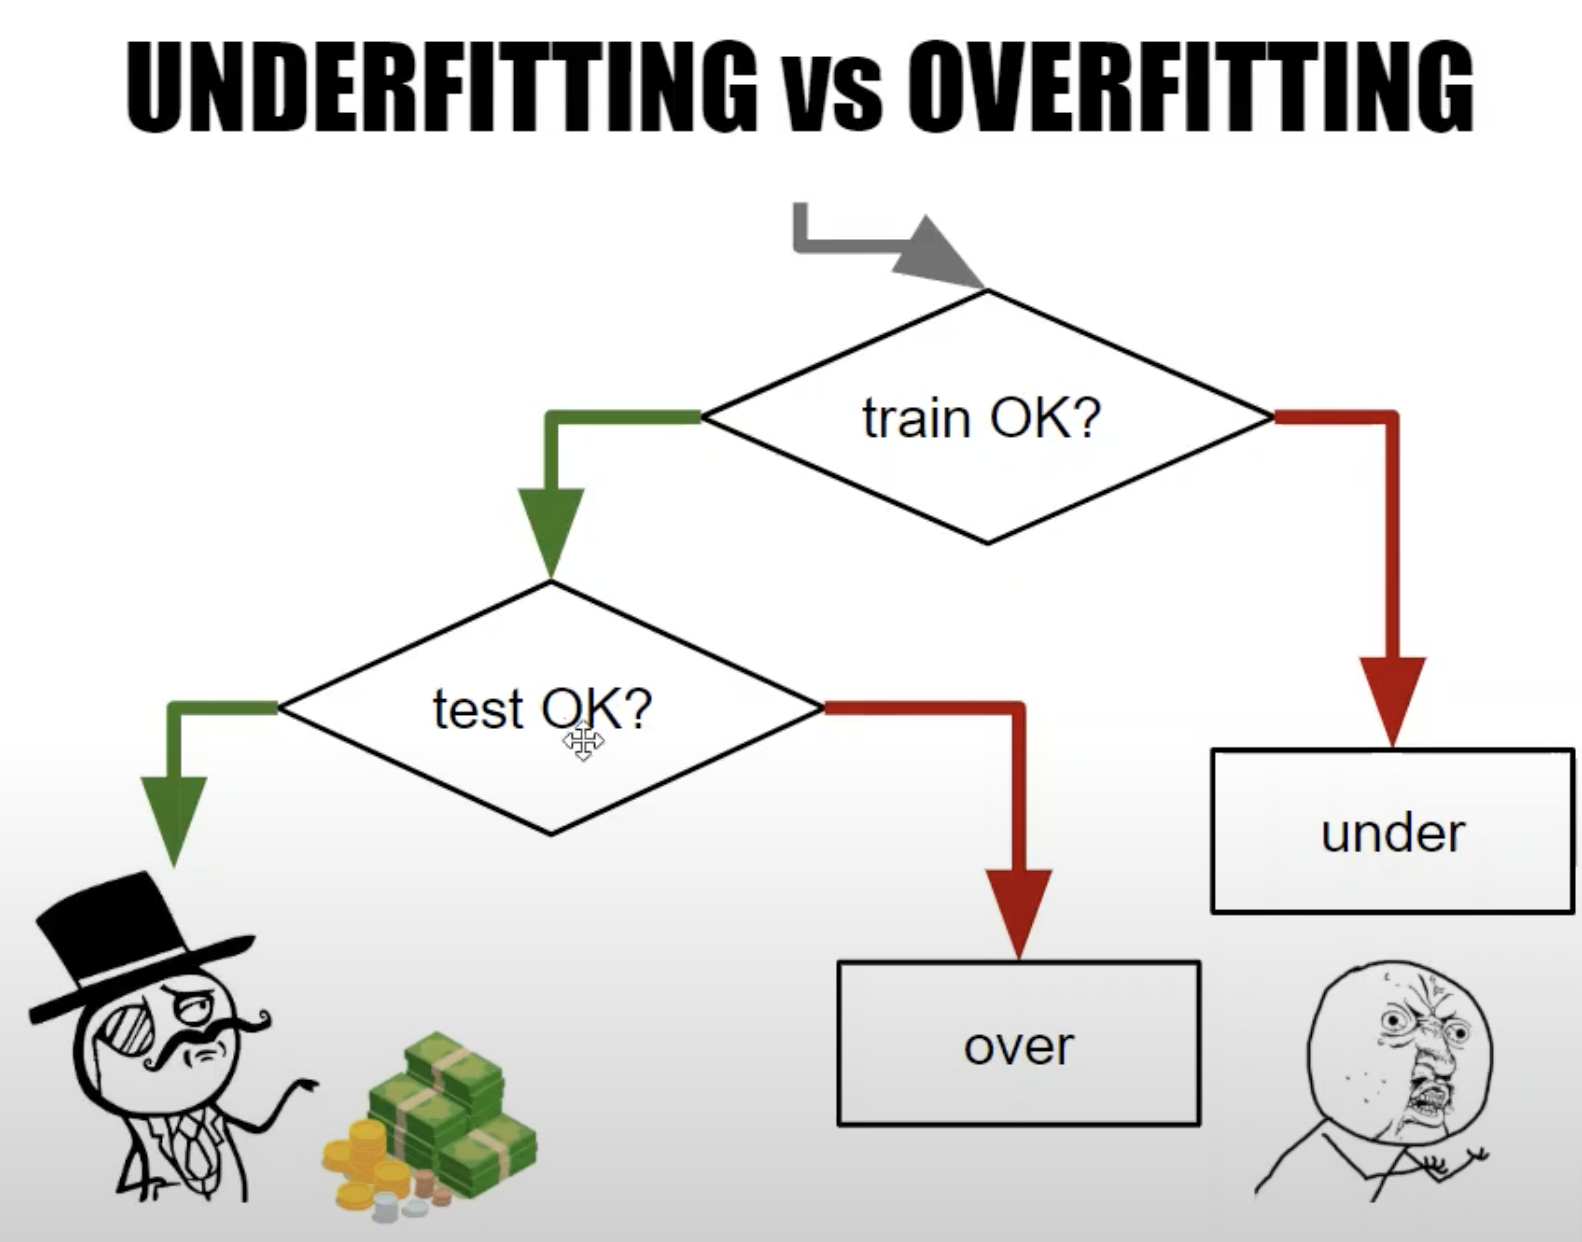
OVERFITTING
It means that model perfectly predicts on training data but has bad performances on test data because it didnt catch entry relations.
The model perfectly understood entry data but isn't able to generalize on new data.
UNDERFITTING
It means that the model isnt understanding well relations on training data and has bad error rate on both training and test data.
Metrics
In ML for metrics is meant a set of algoritmhs able to measure the performances of the model.
Algoritmhs
MAE - mean_absolute_error
Algorimth of misuration for regressors ML algoritmhs.
Error measure that executes subtractions between predictions and and desired outputs.
It takes for each calculated offset the absolute value (|x|, removes +/-) and then it calculates the average between all offsets.
The more MAE is near 0 the more we're near the success.
It's a good error measure because it keeps the measure unit of the input data.
MSE - mean_squared_error
Algorimth of misuration for regressors ML algoritmhs.
Error measure that executes subtractions between predictions and and desired outputs.
It takes for each calculated offset the squared absolute value (|x|, removes +/-) and then it calculates the average between all offsets.
The more MAE is near 0 the more we're near the success.
F1_score
Combines precision and recall metrics into a single metric with the following expression:
F1 = 2 * (precision / recall) / (precision + recall)
Confusion Matrix
It is a graph to visualize the performances of the model: it takes on Y axis the expected target(y) and on the X axis the predictions(p) made.
Squares splitted from the intersection between the expected output and the given output contain the count of correct and wrong predictions based on correct target output.
It's named confusion matrix because it makes possible to understand for each expected output how many times the model returned a wrong or correct answer.
Correct answers count are located in diagonal squares top-left to bottom-right of the chart.
Thanks to this graph we're able to study specific solutions in data preparation, validation, or learning based on errors count results.
Data validation
It's important to subdivide the allocated big data taken as input in 2 parts in order to validate the model generated output.
The first part that usually takes the 70/75% of the total is used for the training, the model will be generated based on this data.
The second part is used for testing once the model is ready.
It's a best practice to test both testing and training datasets.
Python environment
The library the provides machine learning and data mining utils is named scikit-learn.
Code convertions
- Is used to name the variable that contains the x of the function "X" because it's a numeric matrix.
- The output variable is simply named "Y"
- Is used to name the algorithm class with the name of the ML algorithm and its istance as "model"
- All ML algorithm classes expose 2 methods: fit() to train the model and predict() to make predictions on new incoming data.
- ML Tranformers are used to expose 2 methods: fit() and tranform(). Also exists method fit_transform() that merges both methods.
- It's use to name the X as the features of the dataset and the y as the target of the dataset
Obtain & Prepare big data
In past it was used to manually prepare and convert inital dataset into numbers, now sklearn comes with a builtin feature "ColumnTransformer"
able to prepare and transform the whole dataset.
It loops on all dataset records and applies specified transformers/classifiers/vectorizers
Vectorization
It consist in transforming non-numeric values i numbers in order to make ML algoritmh able to use it.
One-Hot-Encoding
Encodes categorical features as a one-hot numeric array. Useful to encode for example a column of sports such as "soccer" "rugby" "basket", ML algoritmhs work with numbers.
Bag Of Words - Text Vectorization
Algorithm of vectorization that allows to vectorize text by losing the order of the words.
Each word of the text becomes a column(feature) of the matrix (text of 100.000 words becomes a 100.000 columns matrix),
repeated words are merged into a single feature.
Bag of words:           | first | hello | world | again | new |
first hello world =>    |  1    |  1    |  1    |  0    |  0  |
hello world again =>    |  0    |  1    |  1    |  1    |  0  |
new world hello =>      |  0    |  1    |  1    |  0    |  1  |
Each string is vectorized into a vector of 0 and 1, where 1 means that the word is present in the string.
TFIDF (Term Frequency - Inverse Document Frequency)
More complex algoritmh based on this that is able to take control of the frequency of the words in the text.
Filling missing values
It consist in find a way to patch missing datasets needed for training the model.
When working with big data it's common to have missing cells of the matrix and there are few ways to fix this problem:
- If there are a few missing cells might be possible to find/generate fake values to fit them.
- If a lot of cells are missing a possible choise is to drop the feature from the dataset.
- It's possible using complex agoritmhs to learn and fit cells based on other cells values. It makes things harder and often isn't the best suitable option.
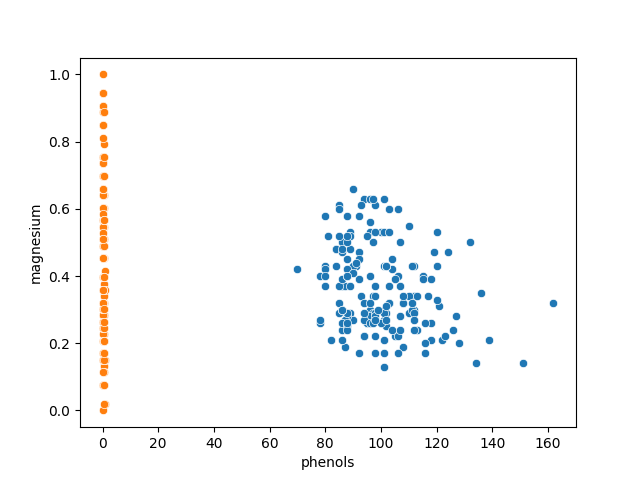
Scaling
In order to understand scaling concept it's necessary to draw the following diagram:
(y)
|
|
|             .B
|    .A                            .D
|                     .C
o ----------------------------------> (x)
The oscillation(offset between points) of X axis is much bigger respect the Y axis one and several ML algoritmhs focus on the bigger offset values (doesn't distribute the focus equally).
Scaling consists in making sure that the variance differences between the features are cancelled. A neutral space is created allowing the algorithm to decide priorities by itself.
Equalizing the differences between features improves the training performances because that algoritmh hasnt to equalize them.
MinMaxScaler
It's a trasformation algorimth that when is applied to the dataset makes sure that oscillation on the graph is equal on X and Y axes.
-
Before scaling transformation:
-
After scaling transformation:
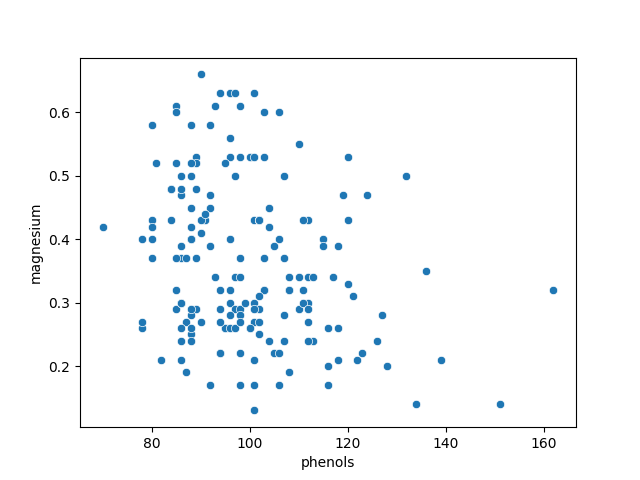
The second graph is more suitable to train a model because of distance equity between axes.