17 K Means Clustering
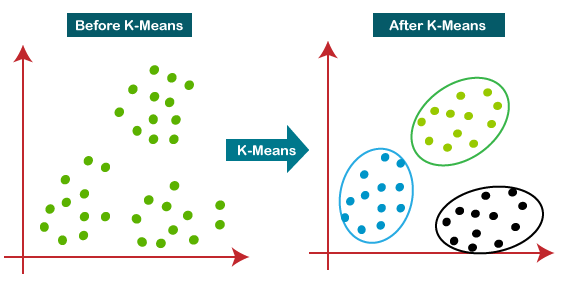
It is an unsupervised learning algorithm that tries to cluster data based on their similarity. Unsupervised learning means that there is no outcome to be predicted, and the algorithm just tries to find patterns in the data. In k means clustering, we have the specify the number of clusters we want the data to be grouped into. The algorithm randomly assigns each observation to a cluster, and finds the centroid of each cluster. Then, the algorithm iterates through two steps:
- Reassign data points to the cluster whose centroid is closest.
- Calculate new centroid of each cluster.
Possible purposes of clustering:
- Cluster similar documents
- Cluster customers based on features
- Market segmentation
- Identify similar physical groups
The overall goal is to divide data into distinct groups such that observations within each group are similar.
The K means clustering algorithm uses Euclidean distance to determine the similarity between data points. Therefore, when using K means clustering, it is important to standardize the data.
In order to use K means clustering is necessary to follow these steps:
- Choose the number of clusters k
- Randomly assign each data point to a cluster
- Until clusters stop changing, repeat the following:
- For each cluster, compute the cluster centroid by taking the mean vector of points in the cluster
- Assign each data point to the cluster for which the centroid is the closest
Choosing a K Value
There's no easy answer for choosing a best K value. One way is the elbow (gomito) method, which consists in running the algorithm several times with different values of K and then look at the sum of squared errors (SSE) for each K and choose the one that is the elbow of the curve.
For example we compute the SSE (sum of squared error) for some values of K (2,4,6,8,10,12).
The SSE is defined as the sum of the squared distance between each member of the cluster and its centroid.
By plotting the K against the SSE it's possible to see that the error decreases as K gets larger; this is because when the number of clusters increases, they should be smaller, so distortion is also smaller. The idea of the elbow method is to choose the K at which the SSE decreases abruptly. This produces an "elbow effect" in the graph, as can be seen in the following image:
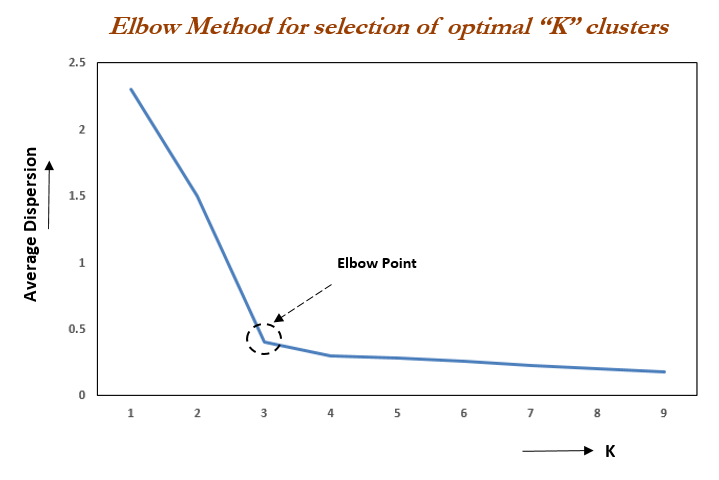
It's named elbow method because the K value we're looking for is the one at which the SSE curve has an elbow, that is a sharp change in direction.
Keep in mind that K means clustering is an unsupervised learning algorithm, so it's aim is to find patterns in the data. This means that it's not possible to use the SSE to choose the best K value, because the SSE will always decrease as K increases. The elbow method is just a way to choose a K value that is reasonable for the data.
Git
CI
GO